A complete quantitative literacy pathway
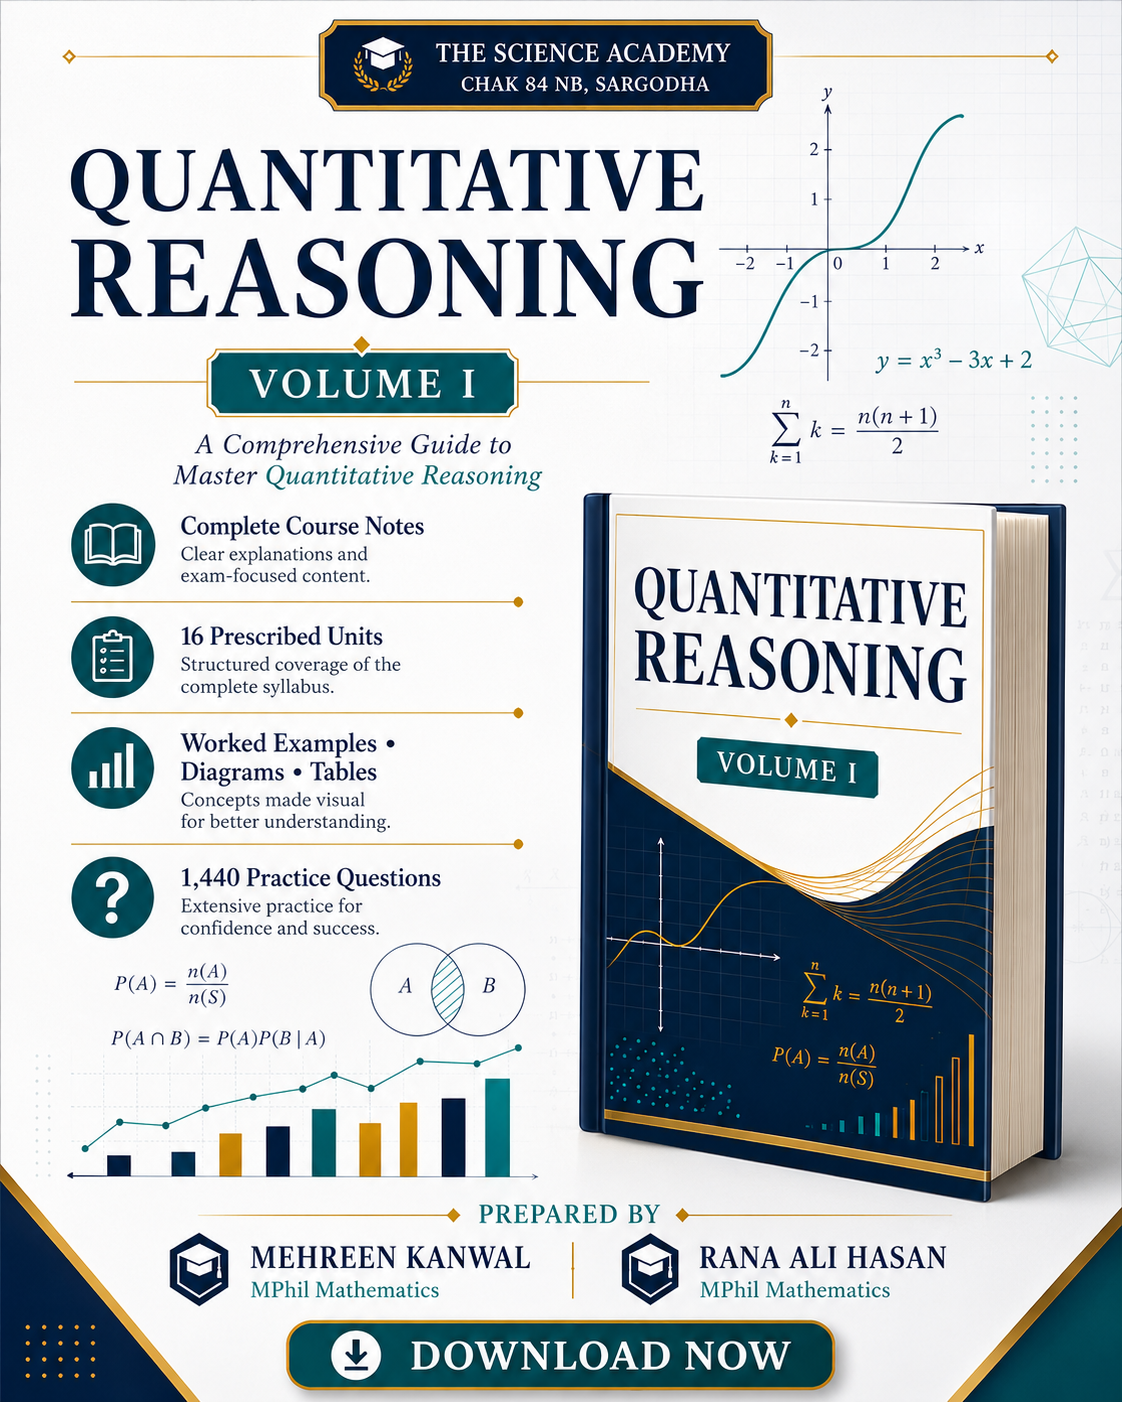
Quantitative Reasoning — Volume I Complete 2026 is presented as a structured university-level learning resource rather than a bare PDF link. It develops quantitative literacy from numerical interpretation and proportional reasoning through data, statistics, probability, finance and applied algebraic models.
The canonical Math Hub title comes first. Legitimate overlapping names include Quantitative Reasoning I, QR-I, Exploring Quantitative Skills, quantitative literacy and URCG-5120 where a university's current outline uses those terms. Naming and semester placement vary by institution.
Numbers become evidence when they are interpreted.
Students often need more than a formula: they need to identify the quantities, question assumptions, read a graph, choose a valid summary, check units and explain what the answer means. This resource moves from definitions and rules to worked examples, exercises and applied decisions.
From calculation to defensible decisions
Read tables, graphs and summaries while checking source quality, scale and missing information.
Match ratios, sequences, counting rules, probability or algebraic models to the structure of a problem.
Use estimates, units, error measures, assumptions and context to detect misleading answers.
Write a final conclusion that states the result, unit, baseline and limitation where relevant.
Useful across undergraduate programmes
- General Education undergraduate students
- BS Mathematics and other BS programmes
- ADP / Associate Degree students
- Mathematics for Computing & Other Programs
- Students preparing for QR-I / URCG-5120-style courses
- Learners revising ratios, data, probability, finance and applied algebra
By the end, a learner can:
- identify quantities, units, assumptions and evidence;
- solve and interpret ratios, rates, percentages and odds;
- classify measurement scales and summarize data;
- use sequences, unit analysis, counting and probability;
- read Venn diagrams and financial indicators;
- build and check practical linear and quadratic models.
Course Contents / Units: 16 / 16
The complete Volume I sequence runs from the meaning of quantitative reasoning to practical finance and applied linear/quadratic scenarios. Select a unit to jump to its detailed theory and practice coverage.
Detailed theory, methods, examples and practice: 16 / 16
Each block keeps the topic-specific concepts, purpose, outcomes, applications, method emphasis, worked-example focus and exercise scope visible in HTML.
Unit 01
Introduction to Quantitative Reasoning
Builds quantitative literacy as contextual reasoning rather than calculation alone.
What is taught
- quantitative versus qualitative claims
- quantities and units
- variables and constants
- assumptions
- evidence and data sources
- estimation and order-of-magnitude reasoning
- reasonableness checks
- the modelling cycle
- contextual conclusions and limitations
Why this unit is taught
Students learn to identify what can be measured, question the quality of evidence, state assumptions and interpret an answer in the situation that produced it.
Learning outcomes
- identify relevant quantities
- question assumptions and data quality
- make defensible estimates
- build simple models
- communicate limitations
Applications / connections
- personal finance
- health statistics
- public policy
- business decisions
- scientific literacy
Method focus
Translate a situation into quantities, units and assumptions before choosing an operation or model; estimate first, calculate second, then test whether the result is reasonable.
Worked-example focus: Estimate a monthly household budget, state which figures are known or assumed, compare the exact calculation with the estimate and write the conclusion in rupees and in context.
Exercise and practice focus: Classification of claims, estimation, unit-aware interpretation and short written conclusions rather than answer-only arithmetic.
Unit 02
Overview of Contributions of Mathematicians and Statisticians, Especially Muslim Scholars
Connects modern quantitative tools with the history of mathematics, statistics and scientific method.
What is taught
- history of number systems
- al-Khwarizmi and algebra
- Islamic Golden Age mathematics
- geometry and trigonometry
- astronomy and quantitative methods
- probability and statistics
- Gauss, Bayes and Laplace
- Pearson and Fisher context
- ethical attribution and notation
Why this unit is taught
The historical unit gives disciplinary context, recognizes contributions often omitted from purely computational courses and distinguishes documented development from simplified myths.
Learning outcomes
- identify major contributions
- connect historical ideas to later methods
- distinguish documented history from myths
- explain why mathematical methods evolved
Applications / connections
- history of science
- Islamic intellectual history
- statistics
- scientific method
Method focus
Read a contribution through its problem, method, notation and later influence; separate a documented attribution from a broad cultural claim.
Worked-example focus: Trace how al-Khwarizmi's algebraic problem-solving tradition connects to symbolic equations while keeping the historical claim precise and source-aware.
Exercise and practice focus: Timeline questions, contribution-to-method matching, terminology checks and short evidence-based explanations.
Unit 03
Types of Standard Numbers
Develops number sense for ratios, data reporting, finance, science and applied algebra.
What is taught
- natural, whole and integer numbers
- rational, irrational and real numbers
- fractions and decimals
- percent representation
- scientific notation
- sign and absolute value
- ordering and intervals
- rounding
- significant figures and magnitude comparison
Why this unit is taught
A learner must classify, convert and compare numbers before applying a formula or interpreting a measurement.
Learning outcomes
- classify numbers
- convert representations
- compare magnitudes
- round appropriately
- use scientific notation
Applications / connections
- measurement
- finance
- data reporting
- science and engineering
Method focus
Identify the number set and representation first, then convert or round at the precision justified by the context.
Worked-example focus: Rewrite a small measurement and a large population count in scientific notation, compare their orders of magnitude and report sensible significant figures.
Exercise and practice focus: Number classification, fraction-decimal-percent conversion, interval notation, rounding and magnitude comparison.
Unit 04
Proportions, Rates, Ratio and Percentages
Explains the quantitative structures used constantly in commerce, media, daily life and science.
What is taught
- ratio notation and equivalent ratios
- proportions
- cross-multiplication with interpretation
- unit rates
- speed, density and rate
- percent as a rate per hundred
- percentage increase and decrease
- percentage points versus percent change
- successive changes
- direct and inverse variation
- scaling and dimensional awareness
Why this unit is taught
Ratios and percentages let a learner compare quantities fairly, but only when the baseline, units and denominator are made explicit.
Learning outcomes
- solve proportions
- compute and interpret rates
- distinguish percentage points from percent change
- model direct and inverse variation
Applications / connections
- inflation
- discounts
- health rates
- population density
- unit pricing
Method focus
Write the comparison with units, choose a common basis, solve the proportion and state whether the result is a ratio, a rate or a percentage change.
Worked-example focus: Compare two package prices by unit price, calculate a discount from the original baseline and explain why two successive percentage changes cannot simply be added.
Exercise and practice focus: Ratios, percentage change, unit rates, direct/inverse variation, discount and inflation questions with interpretation.
Unit 05
Odds and Odds Ratio
Builds careful risk-reporting literacy for medical, social-science and research contexts.
What is taught
- probability versus odds
- odds in favour and against
- probability-to-odds and odds-to-probability
- odds ratio
- 2×2 tables
- exposure and outcome context
- interpreting OR greater than, equal to or less than 1
- relative risk caution
- rare-outcome and causation cautions
Why this unit is taught
Students need to distinguish odds from probability and interpret association without turning an odds ratio into an unsupported causal claim.
Learning outcomes
- convert probability and odds
- calculate odds ratios
- interpret association carefully
- avoid confusing odds with probability
Applications / connections
- epidemiology
- clinical studies
- risk communication
- research literacy
Method focus
Form the odds in the same direction for both groups, use a 2×2 table where appropriate, calculate the odds ratio and explain its direction and limitations.
Worked-example focus: Construct exposure/outcome odds from a small 2×2 table, compute the odds ratio and state what the association does—and does not—show.
Exercise and practice focus: Probability/odds conversions, 2×2 table calculations, OR interpretation and probability-versus-odds comparison.
Unit 06
Scale of Measurements
Shows why the measurement scale determines which summaries and operations are meaningful.
What is taught
- nominal, ordinal, interval and ratio scales
- categorical versus quantitative variables
- discrete versus continuous variables
- valid operations by scale
- coding categories
- Likert examples
- temperature scales
- true zero
- choosing summaries
Why this unit is taught
A code such as 1, 2 or 3 does not automatically make categories numerical; the level of measurement controls valid analysis.
Learning outcomes
- classify variables and scales
- choose legitimate summaries
- recognize arbitrary coding
- explain why zero matters
Applications / connections
- survey design
- research methods
- statistics
- data science
Method focus
Ask what comparisons, differences, ratios and ordering the scale supports before selecting a statistic or graph.
Worked-example focus: Classify temperature, satisfaction ratings and student IDs, then explain why a mean may be inappropriate for a nominal code but useful for a ratio-scale measurement.
Exercise and practice focus: Variable classification, scale identification, valid-operation questions and data-summary selection.
Unit 07
Number Sequence and Series
Formalizes repeated change and prepares learners for growth, finance, algorithms and pattern recognition.
What is taught
- sequence notation
- terms and indices
- arithmetic sequences and common difference
- nth-term formula
- arithmetic series
- geometric sequences and common ratio
- finite geometric sums
- growth and decay
- Fibonacci sequence
- pattern recognition and recursive definitions
Why this unit is taught
Sequences model repeated change and expose the difference between a list of terms and the sum of those terms.
Learning outcomes
- find nth terms
- sum arithmetic and geometric sequences
- recognize patterns
- model repeated percentage change
Applications / connections
- compound interest
- population growth
- algorithms
- design patterns
Method focus
Compare consecutive terms to decide whether a common difference or common ratio is appropriate; verify the formula with initial terms before summing.
Worked-example focus: Model a repeated percentage increase as a geometric sequence, find a specified term and compare it with a linear arithmetic model.
Exercise and practice focus: Nth terms, arithmetic/geometric sums, recursion, pattern recognition and growth/decay interpretation.
Unit 08
Unit Analysis as a Problem-Solving Tool
Uses units as an error-detection system and a systematic method for multi-step conversion.
What is taught
- dimensions and units
- conversion factors
- factor-label method
- unit cancellation
- compound units
- speed, flow and density
- area and volume conversions
- metric prefixes
- currency and unit price
- dimensional homogeneity
- impossible formulas
Why this unit is taught
Unit analysis catches impossible answers and keeps every conversion auditable from the first quantity to the final unit.
Learning outcomes
- set up conversion chains
- cancel units correctly
- check dimensional consistency
- interpret compound rates
Applications / connections
- physics
- chemistry
- medicine
- engineering
- finance
Method focus
Multiply by conversion factors equal to one, arrange them so unwanted units cancel and inspect the final dimension before evaluating the number.
Worked-example focus: Convert a speed through two unit systems using factor-label notation, showing cancellations and checking that the final answer is a speed.
Exercise and practice focus: Metric conversions, area/volume units, compound rates, currency per unit and dimensional-consistency checks.
Unit 09
Data Handling (Small and Large)
Organizes, visualizes and critiques numerical evidence from small tables to larger data collections.
What is taught
- data collection
- population and sample
- primary and secondary data
- data cleaning
- frequency and relative-frequency tables
- cumulative frequency
- grouped data and class intervals
- bar charts, histograms and line graphs
- pie charts, boxplots and scatterplots
- misleading graphs
- missing values and outliers
Why this unit is taught
Good quantitative reasoning starts before calculation: the data source, structure, display and missingness affect the conclusion.
Learning outcomes
- build frequency tables
- select suitable displays
- spot misleading graphics
- summarize data responsibly
Applications / connections
- research
- business dashboards
- public health
- media literacy
Method focus
Identify the variable and data source, clean and tabulate the observations, choose a display that matches the data and critique its scale and omissions.
Worked-example focus: Turn a small list into a frequency and cumulative-frequency table, choose a bar chart or histogram and explain how a truncated axis could mislead.
Exercise and practice focus: Tables, class intervals, relative/cumulative frequency, graph choice, chart critique and missing/outlier decisions.
Unit 10
Data Errors: Absolute and Relative and Their Applications
Measures approximation and measurement uncertainty relative to the scale of the quantity.
What is taught
- true/reference and measured values
- absolute error
- relative error
- percentage error
- rounding error
- measurement uncertainty
- error bounds
- error-propagation intuition
- significant figures
- accuracy versus precision
- tolerance intervals
Why this unit is taught
The same absolute difference can be negligible in one context and serious in another, so error must be interpreted relative to scale.
Learning outcomes
- calculate error measures
- state bounds
- choose appropriate precision
- interpret tolerances
Applications / connections
- laboratories
- engineering quality control
- financial estimates
- measurement science
Method focus
Compare measured and reference values, report absolute and relative error with units or percentage, then explain the accuracy/precision implication.
Worked-example focus: Compare an approximate measurement with a reference value, calculate absolute and percentage error, and state whether the tolerance is acceptable.
Exercise and practice focus: Error formulas, bounds, significant figures, tolerance intervals and accuracy-versus-precision reasoning.
Unit 11
Descriptive Statistics
Turns raw data into interpretable summaries of centre, spread and relative position.
What is taught
- mean, median and mode
- weighted and grouped-data mean
- range
- quartiles and interquartile range
- variance and standard deviation
- population versus sample notation
- five-number summary
- outliers and the IQR rule
- z-scores
- coefficient of variation
- shape and skewness
Why this unit is taught
A summary is useful only when the chosen measure matches the data shape, scale, outliers and question being asked.
Learning outcomes
- compute centre and spread
- choose robust measures
- detect outliers
- compare relative variability
Applications / connections
- data science
- economics
- education assessment
- quality control
Method focus
Sort or tabulate the data, calculate the requested centre/spread measure with the correct population or sample convention and interpret its units and sensitivity.
Worked-example focus: Compare mean/median for a skewed income sample, use the IQR rule to flag an outlier and explain why the median may better represent a typical value.
Exercise and practice focus: Mean/median/mode, weighted and grouped data, variance/standard deviation, quartiles, z-scores and relative variability.
Unit 12
Rules of Counting: Multiplication Rule, Factorial, Permutation and Combination
Builds the counting logic used to form finite probability models without double counting.
What is taught
- fundamental counting principle
- factorial
- ordered arrangements
- permutations and nPr
- combinations and nCr
- order matters versus does not
- repetition cases
- complement counting
- tree diagrams
- multi-stage choices
Why this unit is taught
Counting supplies the numerator/denominator structure behind many probability questions and requires a clear decision about order and repetition.
Learning outcomes
- model counting processes
- choose permutation versus combination
- avoid double counting
- connect counts to probability
Applications / connections
- probability
- computer science
- scheduling
- sampling
Method focus
Describe each stage, decide whether order matters, select multiplication/factorial/permutation/combination and check for repeated or complementary cases.
Worked-example focus: Count ordered committee roles and unordered committee membership from the same group, then explain why the two answers use different formulas.
Exercise and practice focus: Factorials, nPr, nCr, tree diagrams, multi-stage choices, repetition and complement counting.
Unit 13
Probability and Its Application in Real Life
Provides a disciplined framework for uncertainty, risk and expected outcomes.
What is taught
- sample spaces and events
- classical and empirical probability
- complement rule
- addition rule
- mutually exclusive events
- conditional probability
- independence
- multiplication rule
- Bayes theorem introduction
- expected value
- risk and uncertainty interpretation
Why this unit is taught
Probability turns uncertain situations into explicit events, assumptions and rules that can be calculated and communicated.
Learning outcomes
- calculate basic and conditional probabilities
- test independence
- use addition and multiplication rules
- interpret expected value and risk
Applications / connections
- medicine
- insurance
- weather
- quality control
- decision analysis
Method focus
Define the sample space and event, identify whether conditions change the denominator, choose the appropriate rule and interpret the probability in context.
Worked-example focus: Use a conditional probability table to compare two diagnostic outcomes, then explain the difference between the probability of a test result and the probability of a condition given that result.
Exercise and practice focus: Complements, unions, intersections, conditional probability, independence, expected value and real-life risk statements.
Unit 14
A Graphical Perspective through Venn Diagram
Makes overlapping categories, set operations and probability relationships visual.
What is taught
- sets and universal set
- union, intersection and complement
- difference and subsets
- two-set and three-set Venn diagrams
- inclusion-exclusion
- cardinality
- probability regions
- conditional regions
- logic/set correspondence
- word-problem translation
Why this unit is taught
A diagram can expose overlap and avoid double counting before a numerical calculation is attempted.
Learning outcomes
- shade and interpret regions
- solve inclusion-exclusion
- translate words to set notation
- connect sets and probability
Applications / connections
- survey analysis
- logic
- probability
- database-style set queries
Method focus
Define the universal set and named sets, place known counts in the smallest regions first, then use union/intersection/complement notation to complete the diagram.
Worked-example focus: Represent two survey preferences, find the intersection and union, and use inclusion-exclusion to determine how many respondents belong to at least one group.
Exercise and practice focus: Region shading, cardinality, two/three-set inclusion-exclusion, set notation and probability Venn diagrams.
Unit 15
Financial Indicator Analysis and Money Management (Profit, Loss, Simple and Compound Interest)
Builds practical financial numeracy and guards against percentage and interest misconceptions.
What is taught
- profit and loss
- cost price and selling price
- markup and margin
- discounts
- simple interest
- compound interest
- growth factors
- future value
- present-value intuition
- inflation
- real versus nominal comparison
- budgets, savings, instalments and financial ratios
- risk-return caution
Why this unit is taught
Everyday financial decisions require a consistent baseline, a time period, a rate and an interpretation of what the indicator means.
Learning outcomes
- compute profit, loss and interest
- compare options
- interpret growth factors
- build simple budgets
Applications / connections
- personal finance
- business
- banking literacy
- inflation analysis
Method focus
Identify principal or cost basis, rate, period and compounding convention; compute the indicator and compare nominal figures with the real context.
Worked-example focus: Compare simple and compound growth for a savings plan, show the time and rate assumptions, and explain why a percentage discount is not the same as a percentage-point change.
Exercise and practice focus: Profit/loss, markup/margin, discounts, simple/compound interest, inflation, budgets and instalment awareness.
Unit 16
Practical Scenarios Involving Algebraic Expressions: Linear and Quadratic
Turns practical relationships into equations, graphs and interpretable linear or quadratic models.
What is taught
- variables and coefficients
- simplification, expansion and factorization
- linear equations and inequalities
- slope and intercept
- linear models and systems context
- quadratic expressions and equations
- factoring and quadratic formula
- discriminant
- parabola graph
- vertex and maximum/minimum
- break-even, optimization and domain checks
Why this unit is taught
Applied algebra connects words, quantities, equations and graphs while rejecting solutions that make no sense in the original context.
Learning outcomes
- translate words into algebra
- solve linear and quadratic problems
- interpret slope, roots and vertex
- reject contextually impossible answers
Applications / connections
- business cost and revenue
- motion
- area design
- optimization
- modelling
Method focus
Define the variable and domain, build the equation, solve by a justified method, inspect the graph or roots and return only contextually valid answers.
Worked-example focus: Build a revenue/cost break-even model, solve its linear or quadratic equation, interpret the roots and reject any negative quantity that the real situation cannot support.
Exercise and practice focus: Expression manipulation, equations/inequalities, slope/intercept, quadratic formula, discriminant, vertex and applied modelling.
What the learner actually practises
Quantitative foundations
Estimation, order of magnitude, assumptions, units, scientific notation, ratios, rates, percentages, odds and measurement scales.
Data and uncertainty
Frequency tables, graphs, descriptive statistics, absolute/relative error, precision, tolerances and responsible interpretation.
Chance and structure
Factorials, permutations, combinations, sample spaces, conditional probability, expected value, sets and Venn diagrams.
Money and models
Profit/loss, simple and compound interest, inflation, budgets, linear models, quadratic equations, roots and vertex interpretation.
Use the book as a study companion
The Volume I owner source is organized for unit-by-unit theory, explanations, formulas or rules, worked examples, exercise-bank practice and a master formula sheet. A student can read the concept, reproduce the method, attempt a parallel question, check assumptions and then compare the final interpretation.
Why the topics matter outside the page
A repeatable study workflow
- Start with the definition, notation and the real situation.
- Write the known quantities, units, assumptions and baseline.
- Work through the rule or model and inspect every substitution.
- Solve a related exercise without looking at the model answer.
- Check reasonableness, units, graphs, scale, domain and interpretation.
- Record the method in the master formula sheet using words as well as symbols.
For quantitative reasoning, the final sentence matters: state what the number means, what it does not prove and which assumption could change the decision.
One canonical resource, several legitimate entry points
Course titles and semester placement vary. These are discovery pathways only; they do not claim university endorsement, official university notes or affiliation. Each relevant card leads to this canonical HTML page before the PDF actions.
Pakistan University / Course Crosswalk
These entries help a learner recognize overlapping course names and topic families. They are not claims of official Math Hub notes, endorsement or identical syllabus. Verify the current approved scheme with the institution.
| Institution / framework | Relevant course or discovery context |
|---|---|
| HEC Pakistan | Quantitative Reasoning is a General Education domain under the undergraduate framework. This resource uses alignment wording and is not presented as an official Math Hub textbook. |
| University of the Punjab | GQR-101 Quantitative Reasoning I context: numerical literacy, units, ratios and percentages, data, measurement scales, graphs, sets, functions, equations and inequalities. |
| University of Sargodha | URCG-5120 Exploring Quantitative Skills; its 16-topic sequence is strongly aligned with the Volume I identity. Alignment is not university endorsement. |
| COMSATS University Islamabad | MTH103 Exploring Quantitative Skills context for general-education discovery. |
| University of Central Punjab (UCP) | QR101 Quantitative Reasoning I context. |
| Superior University | Quantitative Reasoning-I appears in the BS Mathematics scheme context. |
| Minhaj University Lahore | QRMT111 Exploring Quantitative Skills in AD Mathematics context. |
| University of Narowal | Quantitative Reasoning I/II programme discovery context. |
| The Islamia University of Bahawalpur (IUB) | Quantitative Reasoning I/II appears in selected programme contexts. |
| IBA Karachi | Statistics courses have been categorized under Quantitative Reasoning in a programme-announcement context; this is not an identical-course claim. |
| Habib University | Quantitative Reasoning appears as a Liberal Core/Form of Thought identity. |
| Sukkur IBA University | QR-1 / QR-2 mappings appear in programme schemes. |
| Bahria University | Quantitative Reasoning I/II programme context; verify the current course code in the institution's source. |
| Greenwich University | Quantitative Reasoning I/II programme discovery context. |
HEC's undergraduate education framework includes Quantitative Reasoning in general education. University of Sargodha regulations list URCG-5120 — Exploring Quantitative Skills and URCG-5121 — Tools for Quantitative Reasoning; the URCG-5120 outline has a 16-topic sequence strongly matching this Volume I organization. This page says aligned with / useful for where appropriate, not official university book.
Public and private institution display priority
This is a Math Hub display priority for consistent presentation, not an objective national ranking.
Public / major
- University of the Punjab
- National University of Sciences & Technology (NUST)
- Quaid-i-Azam University
- COMSATS University Islamabad
- UET Lahore
- University of Karachi
- International Islamic University Islamabad (IIUI)
- University of Peshawar
- Government College University Faisalabad (GCUF)
- Bahauddin Zakariya University (BZU)
- University of Sargodha (UOS)
- Government College University Lahore
- IBA Karachi
- Abdul Wali Khan University Mardan
- BUITEMS
- University of Gujrat
- University of Narowal
- The Islamia University of Bahawalpur
- Lahore College for Women University
- University of Swat
- University of Malakand
- University of Balochistan
- Gomal University
- Hazara University
- Karakoram International University
- University of Azad Jammu & Kashmir
Private / non-public
- LUMS
- The University of Lahore
- University of Central Punjab (UCP)
- University of Management and Technology (UMT)
- Forman Christian College (FCCU)
- Superior University
- Minhaj University Lahore
- Riphah International University
- Habib University
- Greenwich University
Recommended Reference Books and Free/Legal Further Resources
These references provide bibliographic and course-alignment context. This page does not reproduce copyrighted reference-book text or offer pirated copies.
- Akar, Zembat, Arslan & Thompson, Quantitative Reasoning in Mathematics and Science Education, Springer, 2023.
- Peck, Olsen & Devore, Introduction to Statistics and Data Analysis, 5th ed., Brooks/Cole, 2015.
- Keith Devlin, Introduction to Mathematical Thinking, 2012.
- Sevilla & Somers, Quantitative Reasoning: Tools for Today's Informed Citizen, Wiley, 2012.
- Bennett & Briggs, Using & Understanding Mathematics: A Quantitative Reasoning Approach, edition aligned to the cited resource.
Use official publisher, author, library or open-course pages for further reading. Compare the current university scheme and cited edition before treating any reference as a prescribed text.
Frequently Asked Questions: Quantitative Reasoning Volume I
What is quantitative reasoning?
Quantitative reasoning is the ability to use numbers, data, mathematical relationships and statistical ideas in context so that conclusions are not only calculated but also interpreted and checked.
Is quantitative reasoning the same as pure mathematics?
No. It uses mathematics and statistics, but the emphasis is on interpreting real situations, making defensible decisions and communicating what the numbers mean.
Who should study this resource?
It is useful for undergraduate students who take Quantitative Reasoning as a general-education or cross-programme course, including students outside a mathematics major.
Does the course use real-life applications?
Yes. Rates, percentages, data displays, finance, probability, growth models, comparisons and decision-making are studied through applied situations.
Does the resource include worked examples?
Yes. The Math Hub quantitative resources are designed around explanations, formulas or rules, worked examples or model solutions and practice.
Can BS and ADP students use the same resource?
Yes where their programme includes the corresponding Quantitative Reasoning course. The website reuses one canonical resource page rather than duplicating the book under each programme.
Is this an official HEC or university textbook?
No. It is independently prepared by The Math Hub. HEC and university materials are used to understand the general-education framework and course outlines; the Math Hub resource remains an independent learning aid.
Why are units and context important in quantitative reasoning?
A numerical answer without its unit, baseline or assumptions can be misleading. Good quantitative reasoning checks meaning as well as arithmetic.
How should I prepare for a quantitative reasoning exam?
Learn the core concepts, practise translating words into mathematical relationships, show formulas and substitutions, check units, interpret graphs carefully and write a final conclusion in context.
Are graphs and tables part of quantitative reasoning?
Yes. Reading and critiquing graphs, tables and data displays is a central part of quantitative literacy.
How many prescribed topic units are in this Volume I resource?
The resource follows a 16-unit sequence, from the introduction to quantitative reasoning through finance and practical linear/quadratic scenarios.
Does Volume I include an exercise bank?
Yes. The owner source is structured with an exercise bank for each unit and a master formula sheet. The published landing page highlights the verified structure without inventing unverified totals.
Is URCG-5120 the only name for this material?
No. University naming changes over time and by programme. The Math Hub canonical book title is Quantitative Reasoning — Volume I, while Exploring Quantitative Skills and QR-I are useful alignment and search terms where relevant.
Does the resource cover Muslim mathematicians and statisticians?
Yes. One prescribed unit provides an overview of contributions of mathematicians and statisticians, especially Muslim scholars.
Does the course cover financial mathematics?
Yes. The unit sequence includes profit, loss, simple interest, compound interest and money-management indicators.
Does it cover algebra?
Yes, at an applied quantitative level. The final unit uses linear and quadratic expressions and equations in practical scenarios rather than treating abstract algebra.
Does it cover probability?
Yes. Counting rules, permutations and combinations, probability and Venn-diagram reasoning are included as dedicated units.
What is the difference between Volume I and Volume II?
Volume I is the complete theory and practice resource. Volume II is its dedicated step-by-step solution companion and has a separate card and page.
What should a student understand in Introduction to Quantitative Reasoning?
This part focuses on definitions, quantities, units, assumptions, estimation, modelling, reasonableness checks and contextual conclusions that support all later units.
Why is Introduction to Quantitative Reasoning important in this course?
It establishes quantitative literacy as contextual reasoning and gives students a structured way to move from foundational ideas to later applications and problem-solving methods.
What should a student understand in the contributions unit?
This part focuses on number systems, algebra, geometry, trigonometry, astronomy, probability and statistics, with attention to documented contributions, notation and scientific method.
Why are mathematicians and statisticians included in this course?
The historical context shows how quantitative methods evolved, recognizes Muslim scholarly contributions and helps students connect later tools with the problems that motivated them.
What should a student understand in Types of Standard Numbers?
Students classify natural, whole, integer, rational, irrational and real numbers, convert representations, compare magnitude and use scientific notation and significant figures.
Why is Types of Standard Numbers important in this course?
Number sense supports ratios, data, financial calculations, measurement and the applied algebra used later in the sequence.
What should a student understand in Proportions, Rates, Ratio and Percentages?
Students work with equivalent ratios, unit rates, percentage change, direct and inverse variation, scaling and dimensional awareness, then interpret the result against the correct baseline.
Why are proportions and percentages important in this course?
They are among the most common quantitative structures in daily life, media, commerce, health reporting and science.
What should a student understand in Odds and Odds Ratio?
Students distinguish probability from odds, convert between them, calculate an odds ratio from a 2×2 table and interpret association with appropriate caution.
Why is Odds and Odds Ratio important in this course?
Medical and social-science reports frequently use odds ratios, so quantitative literacy requires careful interpretation without confusing association and causation.
What should a student understand in Scale of Measurements?
Students classify nominal, ordinal, interval and ratio variables and choose summaries or operations that the measurement level legitimately supports.
Why is Scale of Measurements important in this course?
It prevents invalid calculations caused by treating category labels as if they were measurements with meaningful distances or ratios.
What should a student understand in Number Sequence and Series?
Students use sequence notation, arithmetic and geometric rules, finite sums, recursive definitions and growth or decay connections to model repeated change.
Why is Number Sequence and Series important in this course?
Sequences prepare learners for compound interest, population growth, algorithms, patterns and later quantitative models.
What should a student understand in Unit Analysis as a Problem-Solving Tool?
Students use conversion factors and unit cancellation to solve multi-step problems, interpret compound rates and check dimensional consistency.
Why is Unit Analysis as a Problem-Solving Tool important in this course?
Units expose impossible formulas and catch conversion errors before a misleading numerical answer is accepted.
What should a student understand in Data Handling (Small and Large)?
Students organize small and large data sets with frequency tables, cumulative summaries and suitable charts, while checking missing values, outliers and misleading displays.
Prepared by academic contributors
Both authors contribute to The Math Hub's independent mathematics books, notes, worked solutions and practice resources. No university affiliation, endorsement, rating, award or official status is implied by this resource page.